My audio visualizer experiment

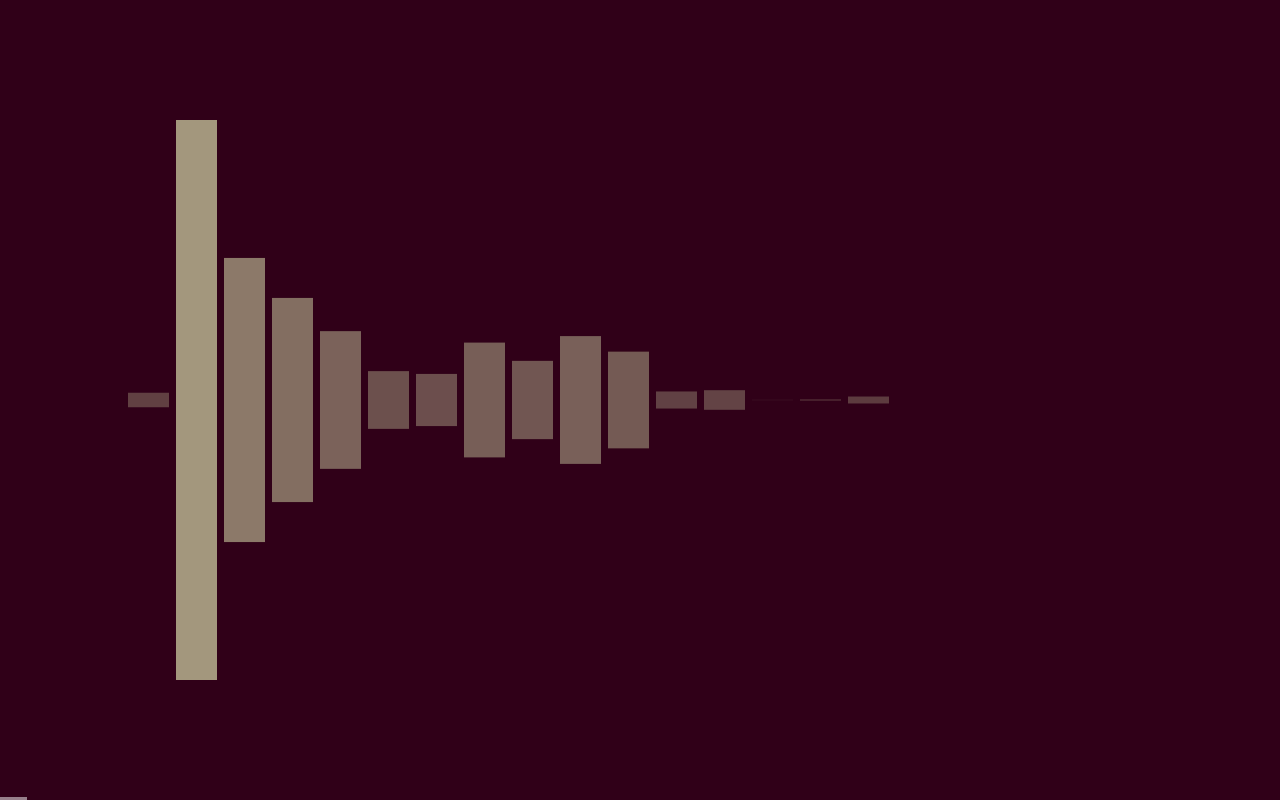
I built a browser-based music visualizer and I named it PartyMode. It’s powered by D3 and the web audio api. No flash or canvas, just html5 and SVG.
Try It Out
Cool. You’re still reading. You can drag in MP3 files, paste in a SoundCloud URL or just hang out with my preselected playlist. It runs best in Chrome, but Safari and Firefox still get the point across.
Why did you build this?
I took a break from coding this year to travel. And travel I did. But the extended vacation left me feeling very rusty. It’s easy to feel out of touch in an industry that changes so rapidly. I wanted a project to help get some confidence back. I’ve always wanted to make my own music visualizer. I have super fond memories of listening to Daft Punk’s Alive 2007 and watching hopelessly mesmerized at the built-in iTunes visualizations. But alas, I just make lowly websites. A few years ago, I definitely don’t think this would have been possible.
A lot of visualizers I encounter look really muddy. I wanted something crisper. With a better palette. Something a little more aesthetically driven. Not just some intricately vibrating vapor trail. I thought D3 might actually be somewhat appropriate. I’m basically just graphing a quickly-changing array of numbers. They’re just really weird looking graphs.
I’d like a somewhat-technical overview
Using the web audio api, I can get an array of numbers which corresponds to the waveform of the sound an html5 audio element is producing. There’s a good tutorial on how to do this. Then, using requestAnimationFrame (with a little frame limiting for performance reasons) I’m updating that array as the music changes. I then normalize the data a bit (or transform it slightly depending on the visualization) and redraw the screen based on the updated array. I’m using d3.js to draw and redraw SVG based on this normalized data. Each visualization uses the data a bit differently – it was mostly trial and error to get some stuff I liked looking at.
Since I’m using D3 – which is just drawing SVG – I was able to style everything in CSS (no images are used at all, including icons). There are a handful of differently colored themes for each visualization, and I do some rudimentary CSS namespacing by updating a class applied to the html element. eg. <html class='theme_1'>. This lets me override or substitute CSS rules pretty trivially. I can add some additional variation to each theme by messing with pseudo selectors. For example, I can use :nth-of-type to hide every nth SVG rectangle or making every odd child have a different stroke-dasharray, etc.
Mousetrap.js handles my keyboard shortcuts brilliantly, and jQuery made life easier.
I developed this primarily in Chrome. Other modern browsers still have some interesting issues (see known issues). I’ve found that WebKit seems to have the most competent implementation of SVG. And specifically Chrome seems to play the nicest with the html5 audio element. For my purposes at least. Running this can easily strain my four year old MacBook’s CPU, but I think I’m pushing several things beyond what they were intended for with this thing. Not complaining.
This and more is on the github page.
the github page
But it doesn’t work.
Sorry. Browsers are always changing, especially when it comes to the web audio API. I’ve released the code on github, so please help me make this better.
Images
At first I was like


but then I was like


Turns out you can take screencasts with Quicktime – and then gifbrewery did the rest.
There are more on github.
more cool gifs